Monitoring is a crucial aspect in the optimization of performance and efficiency of any given system, more so in High-Performance Computing (HPC) which are highly complex. The BigHPC monitoring solution aims to provide users visibility into their job’s resource utilisation and to empower sysadmins to optimally allocate resources for enhanced efficiency.
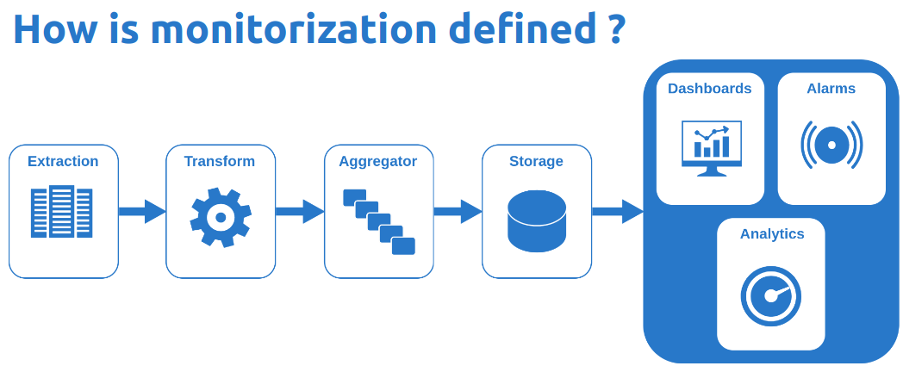
The developed monitorization pipeline, which has been tested in Frontera (a high-performance computing system at the Texas Advanced Computing Center), is composed of several stages such as: metric extraction, transformation, aggregation, storage, ad visualisation with alarms and analytics.
Our solution for each page of the pipeline consists of the following components:
- HECTOR the monitoring probe node metric extraction, transformation, and aggregation.
- Promscale for storage.
- Grafana for creating dashboards, alarms, and analytics.
Extraction
The BigHPC monitorization pipeline begins with the extraction of metrics from various sources within the compute nodes. This includes hardware metrics such as CPU utilisation, memory usage, network I/O, Lustre statistics and others. The metrics are extracted using a combination of Python libraries and APIs, which collect the data in real-time and send it to the central database.
The proposed solution is a singularity container (named HECTOR) that runs in the node which not only extracts the metrics, but also transforms and aggregates them before pushing them to the central database.
Transformation
The next phase in the pipeline involves transforming the metrics. In the case of BigHPC, the data is transformed into a Prometheus-compatible format in order to be compatible with the storage solution (Promscale).
Other benefits of this format are as follows:
- Easy Integration: Prometheus format metrics are widely adopted and easily integrate with a variety of monitoring tools and platforms.
- Simple Structure: The format is simple and straightforward, making it easy to understand and parse.
- Scalability: Prometheus metrics are designed to handle large amounts of data, making it ideal for monitoring large, complex systems.
- Time-Series Data: Allows for the analysis of metrics over time.
- Query Language: Powerful and simple query language that allows for the analysation of data in real-time.
Aggregation
After the metrics have been transformed, the next step is to aggregate them. This process involves collecting the data from multiple sources and merging them into a single, unified view.
Aggregation offers different levels of analysis, such as separating metrics by job, compute node, or process.
The various levels of overview provide valuable insights into trends and patterns in the data, enabling administrators to make informed decisions about system performance and utilisation and allowing users to gain a deeper understanding of their job’s efficiency.
Storage
The aggregated metrics are stored in a centralised database, which provides a single point of access for analysis and reporting. This database should be designed to be scalable and flexible, allowing for the storage of large amounts of data over an extended period.
Promscale is a database designed specifically for storing ad querying large amounts of time-series data, such as the data generated by Prometheus-compatible metrics. The benefits of using a Promscale database include:
- Flexibility: Promscale provides the ability to use both SQL and PromQL, each with their own strengths and weaknesses. SQL is a powerful and well-established query language that is easy to learn and use, while PromQL is optimised for time-series data and provides advanced functions for real-time data analysis. Using both languages provides flexibility in the types of queries and analysis that can be performed.
- Scalability: Designed to handle very large amounts of time-series data, making it well-suited for storing and querying data from complex systems. The combination of SQL and PromQL provides a scalable solution that can handle both simple and complex queries.
- Fast Queries: Provides fast and efficient querying capabilities, allowing for real-time analysis of large amounts of data.
- High Availability: Built-in redundancy and high availability features, ensuring that data is always accessible and protected from failures.
- Easy Management: Easy-to-use management interface, allowing for simple administration and maintenance.
- Compression: Advanced compression techniques to minimise the amount of disk space required to store the data, reducing costs and maximising storage efficiency.
Dashboard, Alarms, and Analytics
The final step of the monitoring pipeline is the creation of dashboards, alarms, and analytics using Grafana. Some of the biggest benefits of using Grafana in the BigHPC scenario are:
- Real-time visibility: Quick and easy access to real-time performance and utilisation data.
- Graphical representation: Visual representation of the data, making it easier to identify trends and patterns. This allows for a clear visualisation of jobs that are underperforming or compute nodes that might be having problems.
- Alarms: Grafana allows administrators to set up alarms that notify them of potential issues or thresholds that have been exceeded.
- Data exploration: Users can interact with their data in a flexible and intuitive manner, making it easy to explore and understand even complex datasets.
- Open Source: free to use, customize and distribute, and its source code is available for anyone to inspect and contribute to. This results in a large and active community of users and developers, who add new features, provide support and ensure the software’s quality. Additionally, being open-source allows Grafana to integrate with a wide range of data sources and technologies.
Conclusion
This new approach to monitoring computing nodes allows both users and sysadmins to derive substancial benefits from the provided monitoring dashboards. Users can have a more comprehensive perspective of the job’s status which may help in optimising the resource consumption in compute nodes by their jobs. Sysadmins can have a better overview of the state of all the nodes in the system in order to better streamline resource allocation.
Júlio Costa and Bruno Antunes, Wavecom
February, 7, 2023